Click to see.


Period 2019 to 2023
Revenue
Farm Fresh grew revenue from 164m to 636m.
Dutch Lady grew revenue from 1067m to 1443m
Net Earnings
Farm Fresh grew net earnings from 27.4m to 50.1m
Dutch Lady dropped its net earnings from 103m to 72m
Gross Margin
Farm Fresh's GPM for 2023 was 23.73% (average of last 5 Years GPM was 26.98%)
Dutch Lady's GPM for 2023 was 29.66% (average of last 5 Years GPM was 32.38%)
Net Profit Margin
Farm Fresh's NPM for 2023 was 7.95% (average of last 5 Years NPM was 11.05%)
Dutch Lady's NPM for 2023 was 4.99% (average of last 5 Years NPM was 9.32%)
ROE, ROA, P/B and P/E
Farm Fresh ROE 7.87% ROA 4.65% P/B 4.33 P/E 55.03
Dutch Lady ROE 16.47% ROA 7.60% P/B 4.81 P/E 29.19
Free Cash Flow
Farm Fresh FCF for 2023 was -174.6m
Dutch Lady FCF for 2023 was 14.3m
Market Capitalisation
Farm Fresh @1.48 per share Market Cap 2,755.6m
Dutch Lady @32.48 per share Market Cap 2,101.6m
How do you decide whether it is a value trap or not?
Value traps are statistically very cheap and very alluring.
First question to ask: “Why is God so kind on you that you are the only one who has this tremendous insight that this stock is cheap and all the other people who are very active, smart and intelligent in the market are ignoring this company?”
Is there an embedded growth optionality in the company? Can the company have a growth phase? Can the company come out with some new product offering which can introduce growth?
This is a dynamic exercise. You will need to revisit the hypothesis every now and again, at intervals.
Two characteristics of value traps are:
So the question you should ask is what is the catalyst which will change this and allow them to reinvest the capital which they are throwing off? In its absence, you have a classic example where the company had great cash flows and no catalyst.
Your sole focus of whether to participate in a seemingly value trap could be you calling out the catalyst that will catapult it out of this situation.
This Is Hands-Down the Simplest Way to Earn $1 Million or More in the Stock Market
By Katie Brockman – Apr 13, 2024 at 4:00PM
KEY POINTS
Building wealth in the stock market requires a long-term strategy.
Consistency is key to reducing risk while maximizing earnings.
The investments you choose can make or break your portfolio.
With a few simple steps, you could be on your way to millionaire status.
Investing in the stock market is a tried-and-true way to generate long-term wealth, and while reaching $1 million may seem like a lofty goal, it's not as difficult as it might appear.
You don't have to be a stock market expert to earn $1 million or more, but you will need the right investing strategy. There's no single correct way to invest, and the best approach for you will depend on your preferences and risk tolerance.
That said, there's a simple and straightforward strategy to maximize your long-term earnings while minimizing risk. Whether you're new to the stock market or just want a no-fuss way to build wealth, this step-by-step process can take you from $0 to $1 million or more.
1. Get started investing right now
The more time you give your money to grow, the less you'll need to invest each month to reach $1 million. Thanks to compound growth, your investments will accumulate exponentially faster over time. Getting started as soon as possible, then, is key to maximizing your earnings.
Even if you can't afford to invest much right now, every year counts. For example, say you're earning a modest 9% average annual return on your investments -- which is just under the market's historic average. Here's approximately how much you'd need to invest each month to reach $1 million, depending on how many years you have to save:
NUMBER OF YEARS AMOUNT INVESTED PER MONTH TOTAL PORTFOLIO VALUE
20 $1,700 $1.044 million
25 $1,000 $1.016 million
30 $625 $1.022 million
35 $400 $1.035 million
40 $250 $1.014 million
DATA SOURCE: AUTHOR'S CALCULATIONS VIA INVESTOR.GOV.
It's never too early to start investing, and the sooner you begin, the easier it will be to build a substantial amount of wealth. You can always invest more later if you can swing it, but you won't get this precious time back.
2. Don't worry about timing the market
The stock market will always be volatile to a degree, and it can be nerve-wracking trying to determine the best time to buy. Many people are understandably worried about investing right before prices drop, and it can be tempting to hold off on buying until the perfect moment.
However, there's never going to be a perfect time to invest in the stock market, and the longer you wait to invest, the harder it will be to catch up later. While it may seem counterintuitive, it's often safer to simply invest consistently no matter what the market is doing.
This approach is called dollar-cost averaging, and it involves investing a set amount at regular intervals throughout the year. Sometimes you'll end up buying when prices are at their peaks, and other times you'll snag investments at steep discounts. Over time, those highs and lows should average out.
Dollar-cost averaging can help take the guesswork out of when to buy, making it easier to invest consistently. Again, time is your most valuable resource when building wealth, so consistency is key to reaching $1 million or more.
3. Choose long-term investments
All investments are subject to short-term volatility, but stocks from healthy companies with solid underlying fundamentals have the best chance of recovering from downturns and earning positive long-term returns.
These types of stocks won't see explosive growth overnight, but they are more likely to earn consistent returns over time. This makes them much safer than short-term investments promising to make a quick buck.
If you'd prefer a more low-maintenance investment, a broad-market index fund or ETF may be your best bet. The S&P 500 index fund, for example, tracks the S&P 500 index and includes stocks from all 500 companies within the index itself. This can help create an instantly diversified portfolio with next to no effort, limiting your risk while still setting you up for positive long-term returns.

If you're willing to put in more effort for the chance to earn above-average returns, investing in individual stocks may be a better fit. This approach requires more research, as you'll need to study each stock you're interested in buying as well as keep up with industry trends going forward. But with the right portfolio, you could earn far higher-than-average returns over time.
Building a million-dollar portfolio isn't necessarily easy, but it's simpler than it might seem. By getting started early, investing consistently, and keeping a long-term outlook, you'll be on your way to becoming a stock market millionaire.
https://www.fool.com/investing/2024/04/13/simplest-way-earn-1-million-in-stock-market/

Johnson & Johnson: Doubling Down On This 2024 Dog Of The Dow
Apr. 12, 2024
Summary
Johnson & Johnson (JNJ) is positioned to gain on the upside due to solid financials, consistent dividend streak, and potential increase in healthcare spending.
JNJ is included in the Dogs of the Dow list for 2024 and I plan to capitalize on the opportunity.
JNJ's financials show impressive growth in both the Innovative Medicine and MedTech segments. The FY24 outlook is strong with continued growth on the runway.
Running a dividend discount calculation gets us to a fair estimated stock price of $188.85 per share. This indicates a double digit upside.
The dividend has been increased for over 61 consecutive years. The current dividend yield is 3%, which sits above the 4 year average yield of 2.66%.
Overview
Johnson & Johnson (NYSE:JNJ) has always been one of those companies that has a product and service offering so wide and large that JNJ can be considered its own healthcare ETF. Johnson & Johnson operates within the healthcare space with focus on some of the following segments: immunology, infections, neuroscience, and oncology to name a few. In addition, they also operate a segment called MedTech, that provides interventional solutions. With solid financials, a consistent dividend streak, and perseverance within an industry that's been lackluster for some time now, I believe JNJ is more attractive than ever and the price is positioned to gain on the upside.

Chart
Data by YCharts
The real disconnect has from the Healthcare Sector (XLV) started back in the pandemic drop of 2020. Despite some ongoing headwinds, I believe we are set to see a very profitable future ahead of us with with interest rates eventually being cut and a large increase of healthcare spending throughout the US. I believe there is a current price connect and I am doubling my position after this recent price drop to the $150 per share level. This is because I think that JNJ is undervalued in terms of valuation. For instance, the current P/E ratio (price to earnings) sits at 17.36x, which sits below the 5 year average P/E as well as the sector median.
JNJ has already reported their Q4 earnings in January to close off their fiscal year 2023. They are set to report their upcoming Q1 earnings on the 16th of April so I will also cover some rough estimates of mine alongside what my future out look is for the company. The current dividend yield is slightly over 3% and JNJ is one of the most reliable dividend stocks in history. They have managed to increase the dividend for over 61 consecutive years, making JNJ a member of the elite Dividend Kings club. Lastly, I wanted to share something that's probably already known, but JNJ has made 2024's Dog's Of The Dow list so I look to take advantage of this opportunity as well.
Dog Of The Dow
The Dogs of the Dow strategy is something that is super simple to implement in practice. It focuses on selecting companies within the Dow Jones 30 index that has the highest current dividend yields. A higher yield in this blue chip context can be for a variety of reasons; maybe the fundamentals have weakened, the industry as a whole is suppressed, or the company is performing badly. Either way, making this list usually means that the price has fallen below its usual trading range.
Since price and dividend yield are inverse of one another, the drop in price causes the yield to spike to levels higher than the normal range. By using this strategy, I aim to capitalize on this elevated dividend yield as I believe the fundamentals of the company are strong enough to bring the price back to the highs. For context, here are the current Dogs Of The Dow:
Symbol Company Yield
(VZ) Verizon 6.51%
(MMM) 3M 5.45%
(WBA) Walgreens 5.21%
(DOW) Dow 4.68%
(CVX) Chevron 4.02%
(IBM) IBM 3.51%
(AMGN) Amgen 3.33%
(KO) Coca-Cola 3.25%
(CSCO) Cisco 3.20%
(JNJ) Johnson & Johnson 3.13%
Like I said, companies can make this list because of their recent poor performance in the short term. For example, Walgreen (WBA) has struggled to continue growing sales for an extending period of time. As a result the share price collapse by approximately -50% over the last 1 year period. Even with a recent dividend cut of -48%, the yield is still inflated to over 5.2%. The same story here for 3M (MMM) has caused the price to struggle for an extending period of time; lower growth metrics, slump in meaningful growth prospects, and a decreasing level of free cash flow. As a result MMM's dividend yield is historically high at 5.4%.
However, some companies make the list due to factors outside of their control. For example, Dow (DOW) has struggled to gain any meaningful momentum due to a combination of higher interest rates, poor macro environment for their industry, and lower profit margins outside of their control. However, they have strategically and efficiently managed their cash to navigate these rough times. As a result, they have a great future ahead once pricing and margins become more attractive. I wrote all about it in depth in my previous article titled: 'Dow: Q4 Earnings Reinforce Great Cash Management For This Stock'.
I wanted to highlight this strategy because it has seen impressive results in recent history. We can see how the Dogs outperform the S&P 500 in return for 4 out of the 5 years listed. Similarly, the Dogs outperform the Dow Jones for 3 out of 5 years listed. While its by no means a perfect strategy, it does offer a bit of a defensive stance as the Dogs typically held up better during down years.
Dogs Of The Dow performance comparison

Dogs Of The Dow
Financials
JNJ operates in two main segments: Innovative Medicine sales & Worldwide MedTech sales. Both of these segments have seen impressive growth metrics with the Innovative medicine segment growing sales by 9.5% for 2023, excluding Covid-19 vaccine related sales. Similarly, the MedTech segment experienced a 9.1%% operational sales growth. Growth in these segments can be attributed to increases in surgery, orthopedics, interventional solutions, and vision.
JNJ reported their Q4 earnings in January to close of their fiscal 2023 figures. As a result we can see that growth was achieved worldwide. JNJ closed off 2022 with $80B in sales worldwide and this has now increased to $85.2B. The only region that experienced a decline was the European market but even then, it was slight a slight decrease from $20.7B to $20.4B which is negligible. Reported sales great by 6.5% to close the year.
JNJ full year sales 2023

Q4 JNJ Presentation
Adjusted earnings per share [EPS] for the full year also saw impressive growth of 11.1%, increasing from $8.93 at the close of last year up to $9.92. Between the two segments, Medtech is where the most impressive growth has taken place. The segment has operational growth of 13.4% for Q4 with Interventional Solutions growing by a whopping 52.3% due to new products such as QDOT and OCTARAY having success in the markets they launched within. The other segment, Innovative Medicine, also saw growth of 4% for the quarter. In this segment there was a large decrease in profits from the infectious disease category but this is completely understandable since this mainly consisted of Covid-related revenue.
JNJ capital allocation strategy
Q4 JNJ Presentation
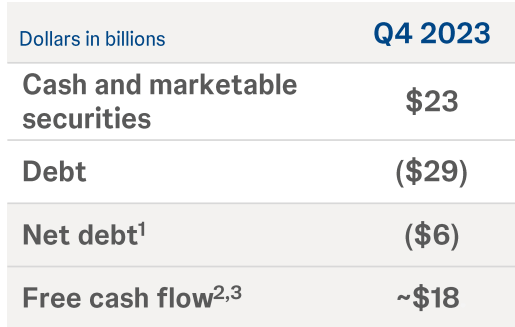
The financial picture here supports the fact that management cares about using capital is the most efficient way possible. They closed out Q4 with a free cash flow of $18B and have successfully used their capital management skills to continue pouring cash back into the business. Cash and marketable securities total $23B while debts total $29B.
Their capital allocation strategy first prioritizes the organic growth needs of different channels within the business. As a result of this, they continue to grow FCF. This FCF can then be used to either invest, growth, research, or develop other areas of their business. Or it can be used to further increase dividend payments and initiate share repurchases.
JNJ closed out their 2023 with over $15B invested into research and development. Over the course of last year they also completed $2.5B worth of share repurchases while paying out a total of $11.8B in dividends to shareholders. This is a company that knows how to handle their cash.
Valuation & Outlook
In terms of valuation, I think that we have a great opportunity for entry at this level. The average Wall St. price target sits at $175.36 per share. This represents a potential upside of 16.75%. I feel highly confident that we are capable of surpassing this price target based on the growth experienced across segments as well as some following valuation metrics. The current P/E ratio sits at 17.36x compared against the sector median P/E of 26.34c. In addition, the 5 year average P/E of JNJ is 20.87x. In addition, the current Price to Book ratio is 4.68 compared to the 5 year P/B ratio of 5.61x.
According to management, adjusted operational sales are estimated to grow at a rate between 5 - 6%. Reported sales are estimated to grow between 4.5% - 5.5% while earnings per share are estimated to grow between 6.4 - 8.4%. Seeing the recent growth delivered over the course of 2023, I think these are highly realistic and likely numbers tat will be achieved. Therefore, I think it would be appropriate to run my own dividend growth model to get another estimated fair stock price.
First, I started by compiling all of the annual dividend payouts for the last few years. Next, I used the estimated annual payout of $4.91 per share for 2024 and inserted it into the calculation. We can see that the dividend has grown at an average of 5.61% per year since 2018. Earnings are expected to grow between 6.4 - 8.4% so I decided to go with a middle of the road input of 7.4% EPS growth. As a result, I determine a fair stock price of $188.85%. This would represent a large potential price upside of approximately 25.7%.

Dividend Discount Calculation
Author Created
Earnings for the full year of 2023 amounted to $10.43/share. Since the growth estimates for each segment are strong, I anticipated a bump in earnings for the full year of 2024. JNJ is set to report their Q1 2024 earnings reported on April 16th. To get a rough estimate, I compiled all of the EPS metrics reported since Q1 of 2019. I took every year's EPS report and calculated out an average EPS growth of 15.74% per year. While this is abnormally strong, I wanted to remain more conservative in my estimate so I want to slice number in half.
Dividend
JNJ has been able to grow their dividend payments for over 61 consecutive years. This puts them in an elite class of dividend kings! As a result they've earned the respect of dividend investors since the income has been so consistent for so any decades. As of the latest declared quarterly dividend of $1.19 per share, the current starting dividend yield is slightly over 3%. For reference, the average dividend yield over the last four years has been 2.66% so you'd be getting a higher yield than normal. The dividend remains well covered with a healthy payout ratio of only 45%. For reference, the average payout ratio of the last 5 years is also 45%. JNJ has about $22.8B in cash from operations to cover any potential headwinds or lack of growth.

Chart
Data by YCharts
We can see how the dividend has grown by 70% over the last decade. Over this time period, this growth equates to a CAGR (compound annual growth rate) of 6.07% over the last ten years. Over a smaller time horizon of 5 years, the dividend has increased at a CAGR of 5.75%. While the yield is only 3%, a larger rate of growth would be more ideal. However, I am thankful that JNJ has not increased the dividend too much since the pandemic because it means they have more cash on hand to ride out the subpar performance of the entire sector and invest in further growth initiatives, acquisitions, and research. For example, JNJ is to acquire Shockwave Medical (SWAV) for $13.1B. Continued moves like this are ways to continue boosting profitability.
The income growth aspect of JNJ truly makes this such a great choice for dividend growth investors. Using Portfolio Visualizer, we can see the growth of income from an original investment of $10,000. This chart assumes that no additional capital was deployed and only dividends were reinvested. Your dividend income would have started out as $300 in 2014 and you'd now be receiving over $661 annually in 2024. Now imagine if you dollar cost averaged into JNJ a few times a year? Your income would grow substantially faster!
JNJ dividend income growth
Portfolio Visualizer

Risk
While I believe strong in my thesis that JNJ is undervalued, there are some risks and factors to consider. With the release of the March CPI Report, the chances of interest rate cuts are less likely. The probability that the federal funds rate will stay the same is now 73.2%. Higher inflation levels can impact consumer spending and reduce all around segment sales and profitability for JNJ. In addition, a higher federal funds rate can mean higher interest payments on debt obligations, although JNJ is currently AAA rated this is less of a worry.
Most important, JNJ has been plagued with ongoing fines and lawsuits. While this has almost always been the case for the company, large lawsuits and settlements chew into profitability. Cough syrup was recently recalled in Nigeria over toxicity concerns. Although early in the process, who knows how far these things can go. Sometime it seems like the abundance of negative news over powers the financials of the company. For example, JNJ may have to pay $700M to settle a talcum powder lawsuit due to marketing this controversial product. In addition, there is also a baby powder suit for $75M that JNJ has to settle with the state of Mississippi. However, $75M is essentially immaterial for JNJ so this is a win.
Takeaway
Johnson & Johnson (JNJ) has had their stock price beaten up for the better part of a year. While the entire healthcare sector has also lacked growth to keep up with the S&P 500 (SPY), I believe this to present a great opportunity to initiate a position or add more shares at these price levels. From a valuation perspective, the stock remains cheap with an average Wall St. target of $175 per share and my own personal dividend discount calculated estimate fair value of $188.85 per share. This presents an opportunity for appreciation anywhere between 16 - 25% after the recent price drop. This becomes even more attractive when you consider that you will also be collecting one of the most reliable dividend streams out there, with a current dividend yield of 3%.
I feel that JNJ has a lot of strong indicators aligned at the moment. Under valuation, a strong dividend, excellent revenue growth across segments, and a current Dog of the Dow. The Dog of the Dow strategy is by no means failproof, but it has historically offered greater downside protection and potential to outperform the greater indexes. On going lawsuits and settlements may disrupt the price movement in the short term, but the fundamentals are strong so I believe will succeed and provide long term growth. As a result, I rate shares of JNJ as a Strong Buy.
https://seekingalpha.com/article/4683388-johnson-and-johnson-doubling-down-on-this-2024-dog-of-the-dow-jnj-stock
Unlocking Q1 Potential of Johnson & Johnson (JNJ): Exploring Wall Street Estimates for Key Metrics
Zacks Equity Research
Thu, 11 April 2024
Analysts on Wall Street project that Johnson & Johnson (JNJ) will announce quarterly earnings of $2.64 per share in its forthcoming report, representing a decline of 1.5% year over year. Revenues are projected to reach $21.38 billion, declining 13.6% from the same quarter last year.
The consensus EPS estimate for the quarter has been revised 0.1% higher over the last 30 days to the current level. This reflects how the analysts covering the stock have collectively reevaluated their initial estimates during this timeframe.
Prior to a company's earnings announcement, it is crucial to consider revisions to earnings estimates. This serves as a significant indicator for predicting potential investor actions regarding the stock. Empirical research has consistently demonstrated a robust correlation between trends in earnings estimate revision and the short-term price performance of a stock.
While investors typically use consensus earnings and revenue estimates as a yardstick to evaluate the company's quarterly performance, scrutinizing analysts' projections for some of the company's key metrics can offer a more comprehensive perspective.
In light of this perspective, let's dive into the average estimates of certain Johnson & Johnson metrics that are commonly tracked and forecasted by Wall Street analysts.
It is projected by analysts that the 'Sales- MedTech- Total' will reach $7.93 billion. The estimate indicates a change of +5.9% from the prior-year quarter.
The average prediction of analysts places 'Sales- Innovative Medicine- WW' at $13.44 billion. The estimate suggests a change of +0.2% year over year.
According to the collective judgment of analysts, 'Sales- MedTech- Orthopaedics- Trauma- WW' should come in at $778.57 million. The estimate indicates a year-over-year change of +2.9%.
The collective assessment of analysts points to an estimated 'Sales- MedTech- Orthopaedics- Spine, Sports & Other- WW' of $736.53 million. The estimate suggests a change of +1% year over year.
The combined assessment of analysts suggests that 'Sales- MedTech- Orthopaedics- Hips- US' will likely reach $250.20 million. The estimate points to a change of +3.8% from the year-ago quarter.
Analysts expect 'Sales- MedTech- Orthopaedics- Hips- International' to come in at $148.34 million. The estimate indicates a change of -0.4% from the prior-year quarter.
The consensus among analysts is that 'Sales- MedTech- Orthopaedics- Knees- US' will reach $232.66 million. The estimate suggests a change of +3% year over year.
Analysts predict that the 'Sales- MedTech- Orthopaedics- Knees- International' will reach $146.04 million. The estimate indicates a change of +2.9% from the prior-year quarter.
Based on the collective assessment of analysts, 'Sales- MedTech- Orthopaedics- Trauma- US' should arrive at $500.35 million. The estimate indicates a change of +1.9% from the prior-year quarter.
The consensus estimate for 'Sales- MedTech- Orthopaedics- Trauma- International' stands at $278.12 million. The estimate indicates a year-over-year change of +4.2%.
Analysts' assessment points toward 'Sales- MedTech- Orthopaedics- Spine, Sports & Other- US' reaching $408.28 million. The estimate indicates a change of +0.6% from the prior-year quarter.
Analysts forecast 'Organic Sales Growth (Operational growth)' to reach 3.9%. Compared to the present estimate, the company reported 9% in the same quarter last year.
https://uk.finance.yahoo.com/news/unlocking-q1-potential-johnson-johnson-131516612.html?guccounter=1&guce_referrer=aHR0cHM6Ly93ZWIudGVsZWdyYW0ub3JnLw&guce_referrer_sig=AQAAAK_nMhZAe1ribDUlfq7jNLCGzhB6rKvlsS-KUUOj82rcWngephRqtPzRgmC2TVD0-pj5s6nIN8FCN8INkv3fJh20Fhdbhs4os3074-LFaafLgetXTx-c62-WAZcenyJlWHf_LjPLLa1uHQg-KPdTlKkM7UnRxMBKVFkDHRSLAAE3
Overview
What Is an Irredeemable Convertible Unsecured Loan Stock (ICULS)?
An irredeemable convertible unsecured loan stock (ICULS) is a hybrid security that has some qualities of a debt instrument and some characteristics of an equity warrant. Like a bond, an ICULS pays a fixed interest coupon to the holder semi-annually or annually at a predetermined rate. Like a warrant or a convertible bond, an ICULS can be converted into common shares of stock, which can appreciate in value for the investor.
ICULs are issued by governments or companies seeking to finance existing operations or new projects. They are especially common in Malaysia, where young or financially weak companies use them to gain access to new capital.
KEY TAKEAWAYS
Irredeemable convertible unsecured loan stock (ICULS) refers to hybrid shares of common or preferred stock that used borrowed funds from investors.
Like convertible bonds, ICULS can be converted into newly issued shares of common stock at a set conversion ratio and price.
ICULS loans are not secured by any collateral, making them more risky and subordinate to other forms of securities.
Understanding an Irredeemable Convertible Unsecured Loan Stock
ICULS's are called "loan stocks" because investors are essentially loaning funds to the issuer. In return, investors enjoy periodic interest income until the ICULS is converted into equity from which the holders receive dividends declared.
The ICULS can be converted to equities at any time up to the expiration date. Some ICULS's require a mandatory conversion when they mature. On this date, the conversion is done automatically, regardless of whether the holder of the security surrenders them or not.
Upon issuance, the ICULS specifies the conversion ratio at which its underlying loan can be converted into stock (one of its distinctions from a conventional warrant). For example, if the conversion ratio is 20:1, this means that one ICULS can be converted into 20 common shares.
The conversion price is the price at which ICULS can be converted into common shares, and it is determined by the conversion ratio. If an ICULS is trading for a nominal value of RM1,000 with a conversion ratio of 20, then the conversion price is RM1,000/20 = RM50. The holder has no choice but to receive the 10 underlying stocks even if the current market price of the stock is less than RM50.
Pros and Cons of Irredeemable Convertible Unsecured Loan Stock
If the current market price of the stock at the time of conversion is less than the conversion price (conversion price RM 50 and market price RM 40, say, using the above example), the ICULS is said to be out of the money. In this case, the holder of the security will be required to pay the difference between the conversion price and the stock price in order to receive the underlying shares. On the other hand, if the stock price is higher than the conversion price, the ICULS is in the money, and the holder receives the stipulated number of shares without having to pay any additional cost.
Special Considerations for Irredeemable Convertible Unsecured Loan Stock
The loan given to an ICULS issuer is not secured by collateral. In the event of default, there is no guarantee that holders will be able to recover their principal investments and future coupon payments. In addition, ICULS cannot be redeemed for cash (hence the "irredeemable" in their name)—a key way in which they differ from conventional convertible bonds. Since they are unsecured and can't be cashed in, ICULS are ranked low on the hierarchy of claims and are subordinate to all other debt obligations of the company.
When irredeemable convertible unsecured loan stock is converted, new shares are issued. When new shares are issued, this results in full dilution for existing shareholders in the company as the total number of shares outstanding increases, leading to a decrease in earnings per share (EPS).
Reference:
By TROY SEGAL
Troy Segal is an editor and writer. She has 20+ years of experience covering personal finance, wealth management, and business news.
Reviewed by JEFREDA R. BROWN
SUMMING IT UP
If you want to use fundamental analysis effectively, you must have a clear understanding of your tools. Currently, this can be hard to do when you are looking at ROE figures because of the inconsistencies in the measurement of ROE.
However, if it’s important to express profit margins as “gross margins,” “operating margins,” or “pre-tax margins,” then it’s equally essential to identify ROE as “net return on beginning equity,” “EACS return on average equity,” or the like. At least, in that scenario, anyone using those ratios will be able to assess their shortcomings and make rational analyses and comparisons.
At a minimum, if you are analyzing a company, you need to understand how the ROE figures weregenerated, and be aware of distortions that can occur depending on the equity figure used.
Use "normalized income after taxes."
If you are calculating ROE on your own, it should be calculated using the most “stripped-down” income available; i.e., “normalized income after taxes,” which excludes all non-recurring and extraordinary items from the income derived from continuing operations. This is not all that easy to come by. Either you, or your data provider’s analysts must estimate the tax implications for the non-recurring items excluded, since such items appear above the tax line on the income statement. At this time, the only data providers I know of that offer normalized earnings are Value Line (www.valueline.com) and Market Guide (www.marketguide.com).
As a practical matter, the second best and probably the “most likely to succeed” would be income available to common shares from continuing operations excluding extraordinary items. And the net income after taxes would be a near next choice.
Best to divide income by beginning equity
The income source, so long as it’s identified, is not the crucial issue however. Far more important is that, whatever income is used, it should be divided by beginning equity in order to exclude any distortions that arise from changes to equity—especially those from the retained earnings. The concept of return must be simple. Whatever incremental increases in income may result from the use of that income should be regarded merely as effective utilization of the beginning equity that produces the return.
At the very least, for those that use average or ending equity, if it’s worth the trouble to consider return on equity at all, then it’s worth the trouble to back out the items that affect changes in equity during the period, if not the retained earnings. The use of average equity is not good, but beats ending equity.
Probably the least useful calculation of ROE uses earnings per share divided by ending book value, because that figure is not only distorted by all of the issues raised above, but it’s also subject to the additional inaccuracies that come from using different values for outstanding shares—e.g., diluted, average, weighted average, shares at the beginning or end of the period—to arrive at the top and bottom of the equation.
To be useful, ROE must be calculated using components that clarify, rather than distort, the return picture. Or, at the very least, as an analyst you must be aware of those possible distortions by being aware of the components used in the calculation. Without this awareness, I would suggest that ROE is simply not what it’s cracked up to be.


